Nick Hubble has asked me to write today about the “Everything Crash”.
In recent times, markets have experienced something that many called the “Everything Bubble”.
A great many asset prices were excruciatingly high, including houses, bonds, crypto currencies and many stocks.
Market bubbles are fairly easy to spot, in one of two ways.
The first sort of market bubble is when prices rocket over a short period of time. This last happened to cryptocurrencies, such as bitcoin, during late 2020 and early 2021. It also happened to fashionable stocks, such as “clean energy” stocks, during 2020 (see the following chart).
iShares Global Clean Energy ETF (NYSE: ICLN)
Last five years
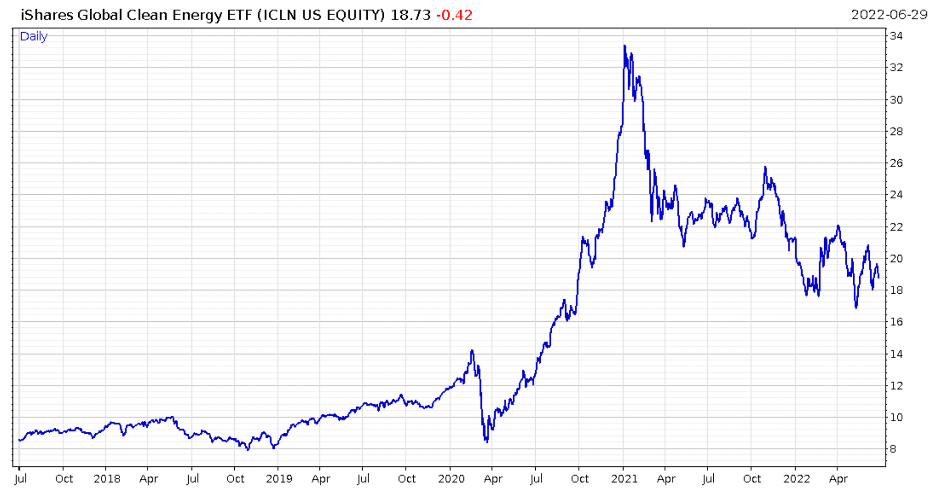 Source: Fuller Treacy Money
The second sort of bubble is when income-yielding assets end up with very low yields. This was, and still is, true of all sorts of bonds (traded debt securities) and houses, where rental yields are very low (especially after maintenance and other costs are deducted).
Whereas bubbles are easy to spot, it’s far harder to guess how much longer prices can continue to climb, or when a bubble will pop. But they almost always do in the end: this is when the arrival of new speculators ends, at which point the bubbles are followed by a price crash. A slow deflation of a bubble is theoretically possible – but it virtually never happens in practice.
Market crashes are also easy to spot. After all, prices are falling hard! But it’s also difficult to know when a crash will come to an end.
This is because, as with bubbles, market crashes aren’t about fundamental factors. Instead, they’re about the emotions of the market mob.
Mass psychology takes over. Rational analysis is discarded. In short, a lot of people panic.
Very often, this leads to markets becoming oversold by the time the bottom is reached. This creates some incredible bargains for those with the cash and confidence to invest at such moments. Then the market can begin to recover and the whole cycle starts again.
There’s no doubt that stock markets are having a rough ride this year. Bond markets and cryptocurrencies are too, but I’ll focus on stocks for now.
Among the hardest hit stocks are the “new economy” or “innovation” type companies, which are often lumped together under the title of “tech stocks”. This is even though often they aren’t really technology companies, but rather companies that use technology to do something else. (Amazon’s delivery business is a good example.)
This “tech” bubble has been most obviously observed in the United States. One of the most famous funds that has been heavily invested in this bubble – and ongoing bust – is the Ark Innovation ETF (NYSE:ARKK), which is run by high profile fund manager Cathie Wood.
As you can see from the following chart, investors in this fund have had a wild ride over the past few years.
ARK Innovation ETF (NYSE:ARKK)
Last five years
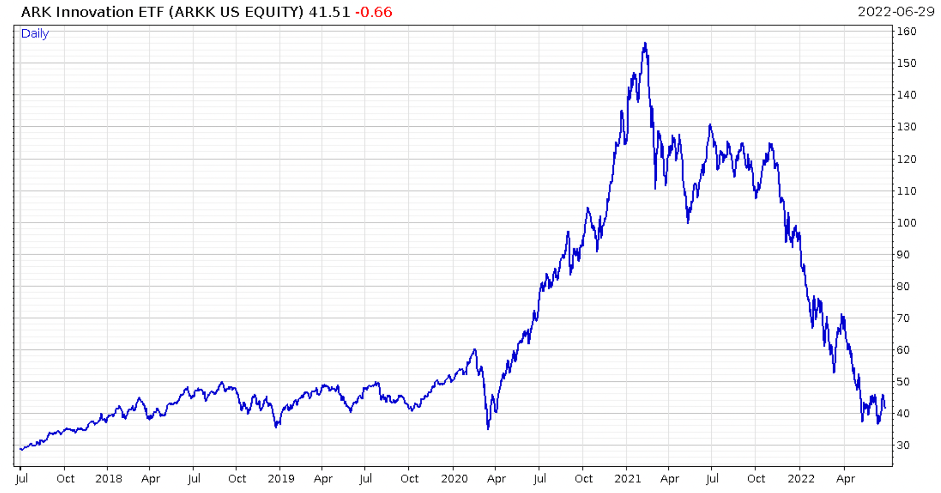 Source: Fuller Treacy Money
After soaring during 2020, it has comprehensively crashed since early 2021. The price is now around the same level as back in early 2018, over four years ago.
The question is whether this fund and the sort of stocks it invests in have reached their bottom yet. Or could they continue to fall sharply?
Put another way, is the tech crash over yet?
There’s one particular stock that, I believe, signals that the answer is “no”. There are bigger falls to come, especially in the more speculative corners of the markets.
The stock in question also happens to be the second largest holding within the ARK Innovation Fund (at the time of writing).
The company is Tesla Inc. (NASDAQ:TSLA), the maker of electric vehicles (EVs) that was started by Elon Musk.
What Tesla tells us about whether the crash is over
Tesla ticked almost all the bubble boxes in recent years.
A trendy product in a fashionable investment niche? Tick.
An outspoken founder who is very good at attracting publicity? Tick.
A dedicated band of followers and fans, almost worthy of being described as a cult? Tick.
There’s no question that Tesla has had a significant impact. That’s in terms of being a catalyst to shift global car production away from internal combustion engines and towards rechargeable batteries and electric motors.
But that doesn’t necessarily mean that the stock is sensibly priced or a good investment.
In reality, Tesla is not really a “tech” stock. It’s a capital-intensive industrial company. It operates in a highly competitive industry, with low profit margins and high exposure to economic cycles.
In a recession, people still buy food and beer. But most of them can put off buying a new car for a year or two. This is why the car industry is so cyclical, with big variations in profits according to economic conditions.
What’s more, Tesla faces a lot of competition. Other car companies are releasing large numbers of new EV models, whereas Tesla’s own model line-up is getting a bit long in the tooth. (For one example of a new competitor EV, take a look at this video.)
Below is a chart of the Tesla share price over the past five years. You can see how it rocketed from below $100 in early 2020 to above $1,200 by late 2021.
Tesla Inc. (NASDAQ:TSLA)
Last five years
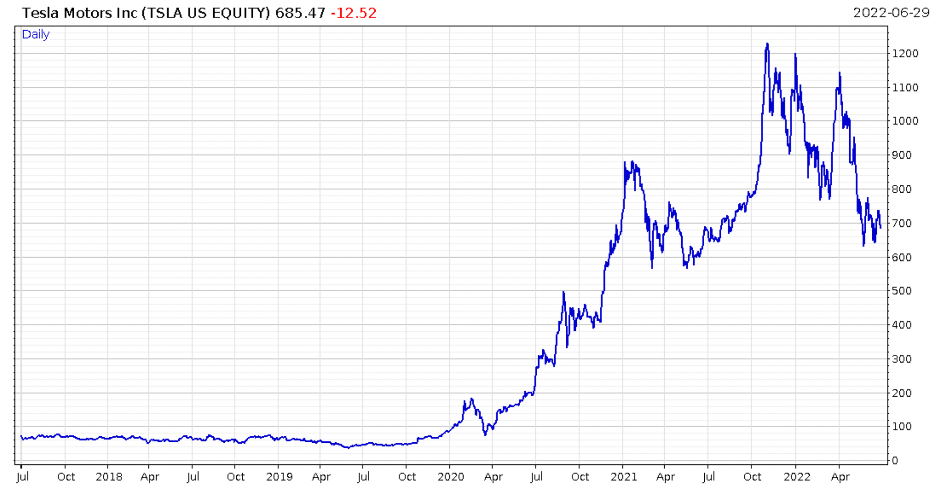 Source: Fuller Treacy Money
That was clearly a massive move in a relatively short space of time, which is one of the clear signs that a bubble is present. Since then, the price has dropped back to around $680.
That’s a big pull back, but it’s clearly still way above the early 2020 level. That’s in stark contrast to the ARK Innovation Fund (see the earlier chart).
To me this signals that the market bubble hasn’t fully burst. Tesla has been one of the bubbliest of the bubble stocks, and one of the memeyist of the “meme” stocks.
Until it has fully returned to Earth, metaphorically speaking, then I believe that the Everything Crash has further to go.
Let me back that up with some figures.
Toyota Motor Corporation is a huge car company that vies for the position of top dog globally with Volkswagen. It’s widely accepted that Toyota’s cars are well made, which is why it’s so successful. At the time of writing, it has a market capitalisation (value at the current share price) of 29 trillion Japanese yen (about $214 billion).
Meanwhile, Toyota’s top line sales revenue was about 31.4 trillion yen in the year to 31 March 2022. This means that Toyota shares trade with a price-to-sales ratio (P/S) of 0.92 (which is 29 divided by 31.4).
Now let’s compare that with Tesla. At a share price of $681, this company has a market capitalisation of $706.6 billion (or well over three times that of Toyota). Meanwhile, revenue for the 12 months to the end of March 2022 came to $62.2 billion.
This gives Tesla a P/S ratio of 11.36, which is also a staggering 12 times the equivalent ratio for Toyota shares.
Now, let’s be generous, and say that Tesla deserves a premium because it’s going to keep growing faster than Toyota in future. Let’s say it’s really worth a P/S ratio of 2, which is more than twice Toyota’s level.
Even so, that would make Tesla shares worth one sixth of their current price, or $110.
Put another way, this back-of-envelope analysis suggests that the current shareholder of Tesla still risk losing 83% of their investment.
What’s more, given that crashes tend to overshoot, it’s very possible that Tesla’s shares could head below this level.
For this reason, I don’t believe the crash will be over until Tesla shares are priced at around $100, and possibly much lower.
As things stand, we’re a long way from that. And as such, it’s a time to remain cautious, which is what we’re doing at UK Independent Wealth.
I suggest you do the same.

Rob Marstrand
Investment Director, UK Independent Wealth