- MV=PY was all you needed to know
- Velocity turned up, as predicted, with the predicted results
- What happens next for inflation depends on V not M
In June 2021, I published a report that told subscribers to “Prepare for an inflation spike unlike any you’ve seen before”. The premise was simple: governments and central banks had pumped an unprecedented amount of money into the economy while shutting it down with lockdowns. These two policies had negated each other. The lockdowns cut economic activity, but the flood of money kept things from crashing. Indeed, the stock market recovered rapidly and the property market boomed!
But reopening the economy without removing the money that had been pumped in would cause prices to spike. A recovery in the ability to spend coupled with vast amounts of money available to spend were the spark and fuel needed to create a whopping inflationary fire.
At the time, the idea was absurd and I was roundly lambasted. After all, I’d been one of those crying “inflation” back in 2009, when quantitative easing (QE) first re-emerged as a policy in its more modern form. However, it seems austerity was enough to rescue us from that inflationary calamity.
And, sure enough, July’s inflation came in bang on target for the Bank of England (BoE), at exactly 2%.
What happened next was, however, a rather memorable inflation spike.
Let’s review what allowed me to make my prediction. It’s all got to do with the rather simple equation MV = PY, as I explained back in June 2021…
***
M is the money supply
No James Bond jokes please – this is serious. M refers to how much money is in the economy.
Unfortunately, that becomes a complicated concept in our fiat currency world. “Money used to be gold, and nothing else,” as JP Morgan famously said. Well, when he said it, money was actually still gold, under the gold standard. But these days, money is a little more flexible.
For example, is the money you spend on your credit card money? Or is that debt? Is the unused portion of your credit card limit money?
Is the money in your savings account money? Well, can you spend it, or is it lent out to others by the bank?
Does QE really increase the money supply or just “bank reserves”? Are bank reserves money?
Don’t answer – those are trick questions. These days, economists have simply got different definitions for different “levels” of money. The names “broad money” and “narrow money”, two of the levels of money classification, sort of explain this nicely.
But M is not our real topic this month. So, let me introduce you to our vendetta bound V…
V is the velocity of money
V refers to how fast, or often, money is spent. Some examples offer the best explanation for what this really means.
If the same five-pound note goes from being spent just once a day to twice a day, it feels like there is twice as much money sloshing around the economy. The money supply hasn’t increased, but it feels like it has doubled.
V, or the velocity of money, is what has changed in this example. The speed, or frequency, with which money is spent.
Let’s edge closer to what has actually happened during the pandemic (and also happened in 2008). Central banks created vast amounts of money (M) under quantitative easing (QE). But it was saved instead of flying across shop counters. The fall in V negated the increase in M. More money was spent less often. The two immense forces offset each other. That’s why inflation didn’t emerge after 2008 and why it hadn’t during the pandemic (until recently) despite the vast QE. More on that shift below.
Here’s what you really need to understand about V. As you can imagine, when inflation begins, people try to spend their money faster. They try to get rid of it quickly to avoid the loss of value from holding it. This means V (the velocity of money) speeds up when inflation begins. Which, in turn, makes the same amount of M (money) feel like even more money. And that only accelerates the inflation even more.
But I’m getting ahead of myself. Let’s look at the other side of the equation before we explore what’s about to happen.
P is prices
If the world had only one good – a metaphorical widget – this explanation would be a simple one. P would be the price of that widget. But there are many goods in our economy. Still, their price can be thought of as “P” – the general price level.
This makes a little more sense if you think of it in the following way: a change in P is what we call inflation or deflation. Rising or falling prices.
The challenge of establishing P, or measuring changes in P, is a long and fascinating story. But I believe we’ll be encountering such a large surge in P that those debates won’t matter. Inflation will be so obvious that no amount of government statistical fiddling will be able to hide it. So, let’s move on to the last part of the equation.
Y is real GDP
I know, a helpful definition, isn’t it? Swapping one acronym for another is the sort of thing you expect from the HMRC website.
In our widget economy example above, Y is the number of widgets. The amount of stuff. Production, supply, the economy – however you want to think of it.
Y is what the whole economics kerfuffle is really all about. Because what we really want is to maximise our economic wellbeing. The question is how we do this.
What does MV=PY really mean?
When you put the four components together, you get MV = PY. Which basically just means that, in an economy, the amount of money times the speed with which it is spent is equal to the price of stuff times the amount of stuff.
This is an identity, meaning it is inherently true. It’s the economics version of an accountant’s double-entry bookkeeping, where everything must balance in the end.
Here’s a simplified example:
An economy with £10 in money (M) which is spent once a year (V) on 10 widgets (Y) costing £1 each (P).
MV=PY so £10 x 1 = £1x 10
I know that doesn’t seem useful or interesting. It’s self-evident, after all. But the equation comes alive when you explore how it changes over time. Or, if you’re a politician or central banker, how you can make it change over time.
Playing with MV=PY
If you double the money supply in an economy, what happens to our equation above?
Well, the equation must balance. So, if you double one side, the other side must double too. Either the price of all widgets in the economy must double, the amount of widgets must double, or some combination between the two.
This is how quantitative easing (QE) is supposed to generate inflation and stimulate the economy. Printing money should force up P and Y – inflation and real GDP.
[…]
The pandemic’s effect on MV=PY
During the pandemic, the MV=PY equation fared worse than a Piñata at a 16-year-old baseball player’s birthday party. But don’t forget, it’s an identity and must therefore always hold true. So, let’s get to some hard data.
The lockdowns meant that the economy (Y) crashed. It was the biggest drop in GDP for 300 years in the UK, for example.
On the other side of the equation, the velocity of money (V) plunged too. People saved instead of spending. In the United States, where the velocity of money figures are readily available, the chart of V fell off a cliff.
This data set goes back to the 1960s and velocity has never been anywhere near as low as in 2020. Although the 2008 financial crisis and 2001 technology media and telecommunications (TMT – sometimes called the dot.com) bubble crisis did see large falls in V too.
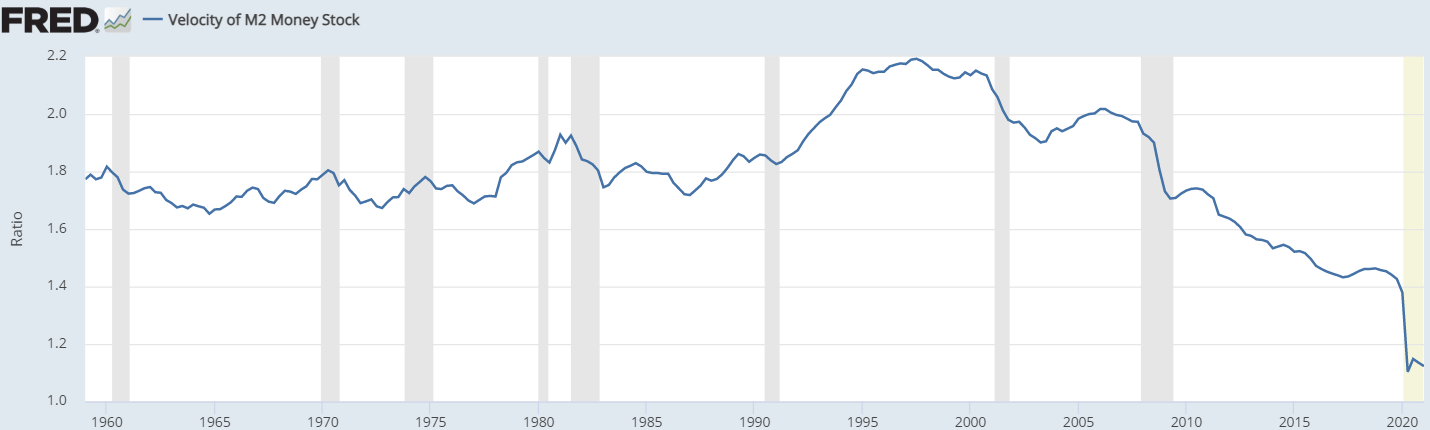 Source: FRED – Federal Reserve Bank of St. Louis
As you know, central bankers responded to this drop in V by creating vast amounts of money (M) in order to try and pump up the economy (Y) and keep prices stable (P). This chart shows one measure of M in the US, going back to 2005. Notice how the 2008 QE efforts barely show up compared to 2020.
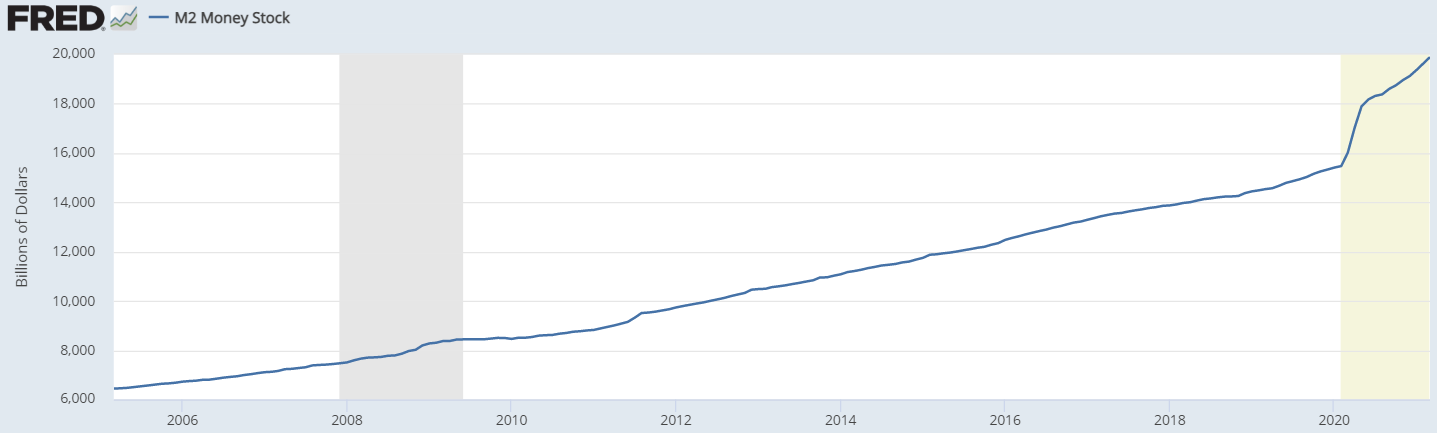 Source: FRED – Federal Reserve Bank of St. Louis
If I’ve lost you, don’t worry. Because it’s what happens next that’s fascinating terrifying.
You see, if the end of lockdowns leads to a surge in the velocity of money as people spend more, we are going to see an explosion in P. We’re talking “transitory hyperinflation”, as one Bank of America’s analysts put it…
***
Sure enough, inflation went on to spike spectacularly. But was I right about velocity being behind the shock?
This updated chart of one measure of the velocity of money shows a significant uptick to V since the end of 2021:
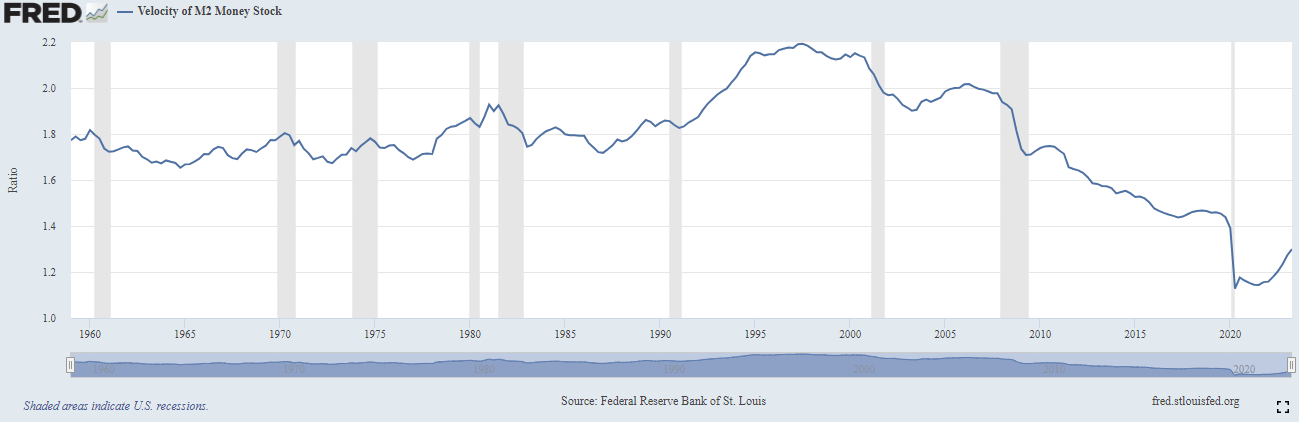 Source: FRED – Federal Reserve Bank of St. Louis
The question is whether this is just the beginning of a recovery in velocity.
If the inflation we’ve had causes a further spike in velocity to occur, as academic theory would suggest, it will renew the inflationary trend we saw in 2022 and 2023.
We may be stuck with double-digit inflation persistently for years to come yet…
Until next time,
![]()
Nick Hubble
Editor, Fortune & Freedom