- Sports analogies can help us understand financial markets
- The ins and outs of baseball and bull markets
- We’re not near a market top… yet
Your usual editor has been stuck down by a case of the man-flu. And so, it’s over to our guest contributor, Conor Mac from the newsletter and blog Investment Talk. As strange as it may seem, he’ll use baseball to investigate whether the current bull market is a bit long in the tooth, or barely getting started. Read on to discover the answer…
***
What Inning Are We In?
Demystifying a common baseball analogy to make you sound smarter at dinner parties
Investors love using sports metaphors. The other day I heard someone say they think we are in the 3rd inning of this market. This baseball analogy is one I have heard numerous times, and it used to fly over my head because the sport is not popular in the UK. Eventually, it resurfaced enough times that I ventured to understand its meaning. If you are unfamiliar with cricket or baseball, I suspect the metaphor might also be lost on you.
In baseball, a game is divided into nine innings. Each inning has two halves; the top and the bottom. In the top half of the inning, the visiting team bats while the home team fields. In the bottom half, the roles are reversed. The batting team want to score runs (when they complete a run around all the bases) and the fielding team want to score outs (rendering a batter or runner unable to play). There are numerous ways a player can be put out, but it’s not important for this conversation. If a team gets three outs during an inning, the inning ends and it’s time for the other team to bat. The game continues until the nine innings are over, or until one team accumulates 10 runs. If the score is tied at the end of the nine innings, it goes into extra innings, where a team must lead by two runs to claim victory.
All you need to take away from this is that as the number of innings played increases, the end of the game edges closer. Investors, therefore, draw comparisons between the maturation of a baseball game and identifying what stage of the market cycle we are in. An important distinction is that there can be no innings without a game in play. Therefore, the concept of innings and the market cycle refers to which stage of a bull market we are in. There are no innings for the stage when everyone is crying into their shirt pocket. At this point, the game is temporarily over, everyone must go home. There are many versions of the market cycle, so we’ll keep it simple and stick with John Templeton’s; bull markets are birthed in pessimism and cremated in euphoria. It’s during these later stages of the cycle that investors become concerned about having to pack up and start all over again.
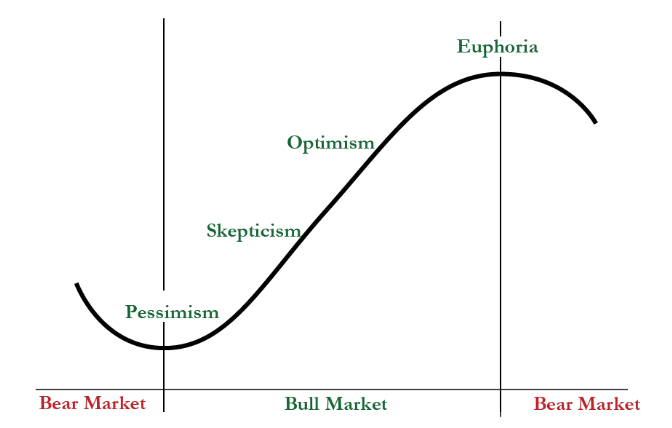 John Templeton’s Market Cycles
The batter and the investor are quite alike. Both have to make decisions about when to swing and when to exercise patience. Both are exposed to outcomes which dance with the variables of skill and luck. They both want to hit home runs… But unlike baseball players, who go home and live to play another day, the end of a market cycle can be incredibly wealth-destructive to an investor. These outcomes may have a significant influence on our net worth; naturally, it’s within our nature to want to know when the next bull market is about to collapse or when a new one is set to begin. And as Joseph Fahmy, Advisor at Zor Capital, recently reminded us; “history doesn’t always repeat itself, but it tends to rhyme”.
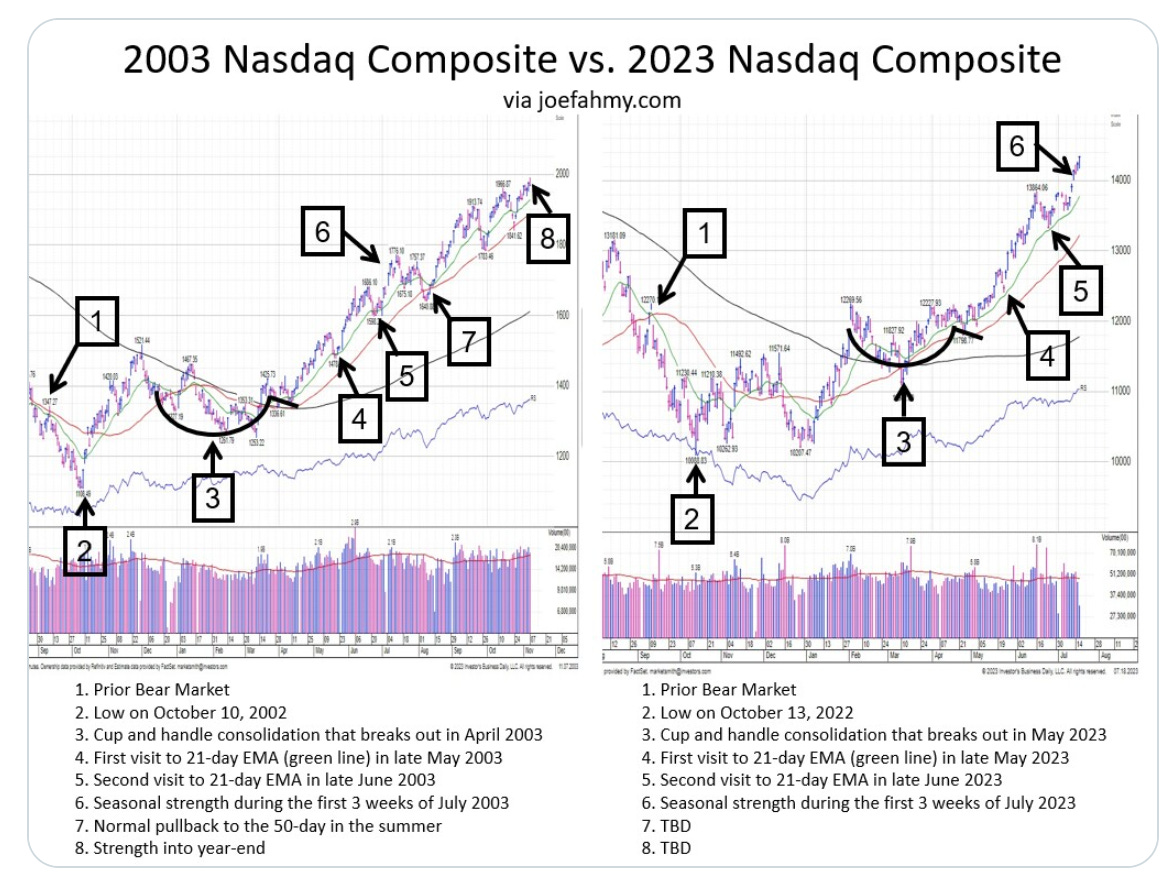 Chart from Joseph Fahmy’s Twitter account
The fact that history has a tendency to rhyme tricks investors into assuming they can predict what happens next when those repetitive patterns emerge. The idea is that a bull market is supposed to pass through various innings before it abruptly ends and starts over. There is no need to overcomplicate things; having a definition of each inning. You could illustrate the innings as quarters (now we are moving on to NFL analogies).
- First Quarter: Young bull market, the hype-cycle starts spinning, multiples begin to re-rate and optimism returns. There are still bears talking about projected earnings looking weak. An earnings reccession is still present on a trailing basis. Leading macroeconomic indicators look positive.
- Second Quarter: Earnings and fundamental estimates are revised upwarwards in light of more optimistic outlook. The market begins to react positivley.
- Third Quarter: Somewhat of a lock-out rally. The market continues to march on. Those who were previously sceptical and sitting on the sidelines give up and join in. This is called “the chase”.
- Fourth Quarter: Excuberence follows complacency. Markets can stay irrational for a long time. The much-anticipated blow-off top seems to take forever to come. So long in fact, people forget they were anticipting one. They settle into the new normal, they get greedy. Then BAM, it all comes crashing down.
It doesn’t really matter what exact inning we are in, because this is hardly an exact science. It might be better to focus on the early and late innings. In other words, ask if the party is just getting started, or if someone has just turned the lights on at the afterparty and you suddenly start questioning your life decisions.
So, Where Are We?
Accurately discerning where we are in the cycle has its advantages. It may allow you to position accordingly. I don’t wish to make a definitive statement about where I think we are, because I have no idea, but I can do my best to outline some of the signs.
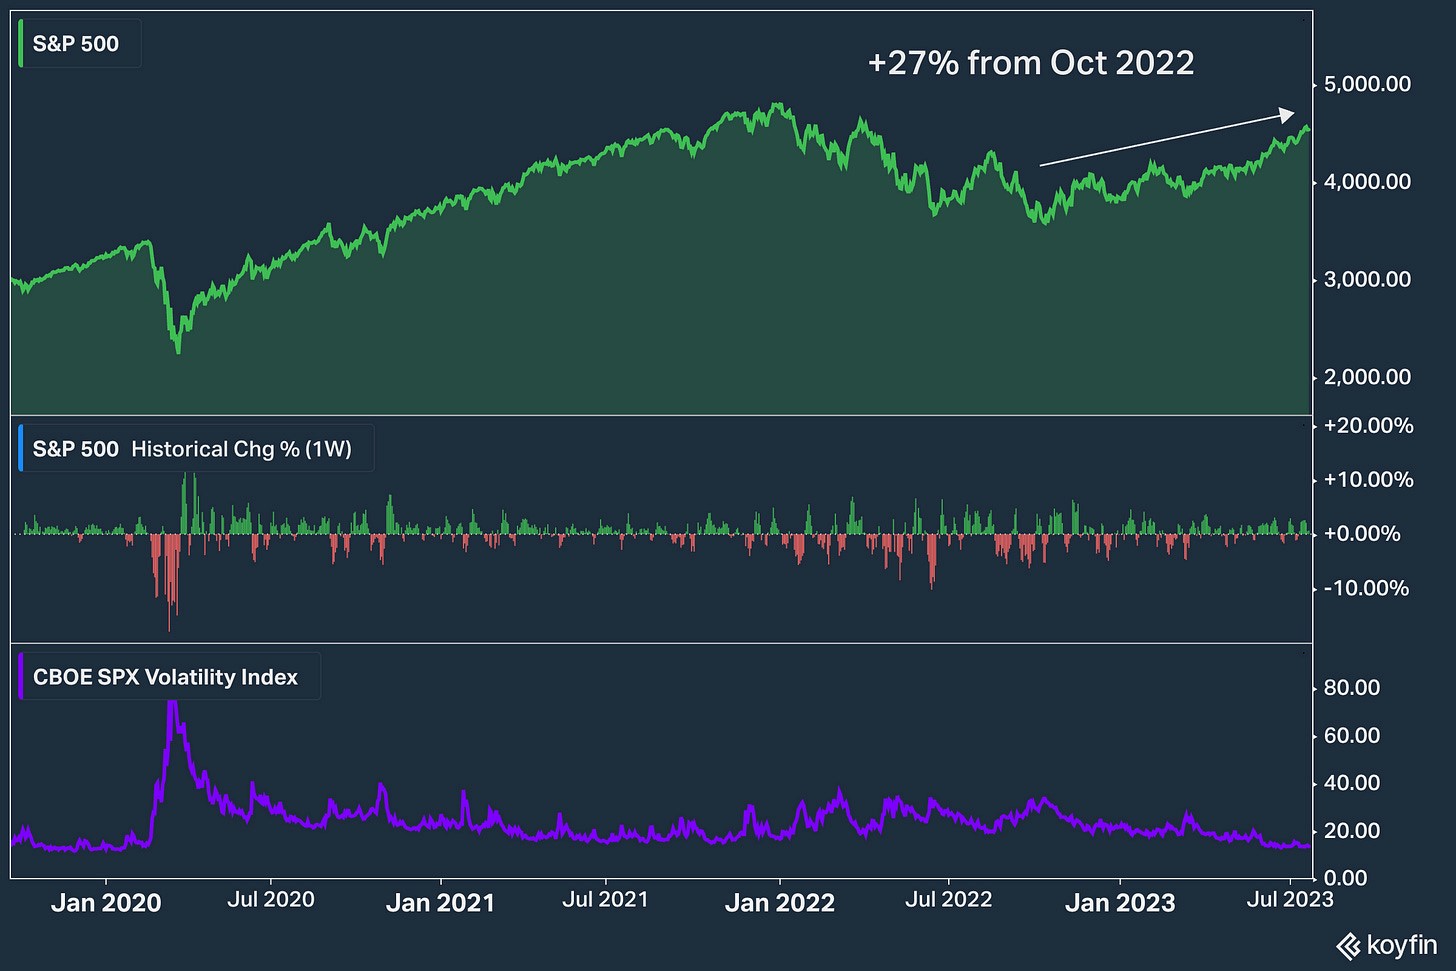
While there has been a lot of talk about exuberance in the market lately, the major indices have only recently retraced their bear market bloodshed and officially entered new bull markets. Jurrien Timmer, Director of Global Macro at Fidelity feels that the retracement in the S&P 500 has been so strong that it rules out the chances it’s a bear market rally in disguise.
“The stock market has regained nearly three-fourths of the ground it lost last year. Bear-market rallies don’t retrace much more than half their preceding decline. When they do, they are usually new bull markets”.
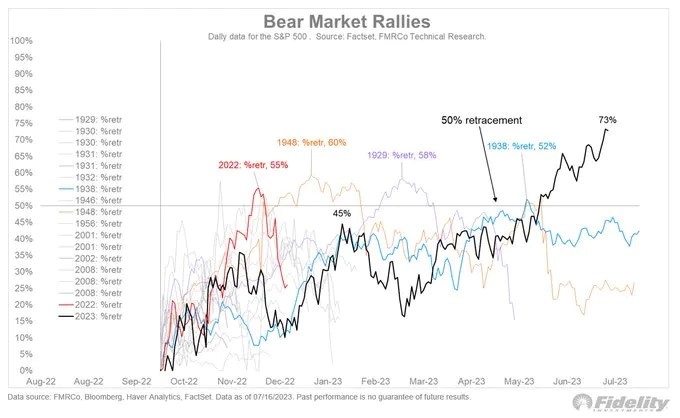 Chart from Jurrien Timmer’s Twitter account
Price action alone is not a useful indicator in establishing if we are close to a top or bottom; despite what you will often hear in the headlines. There is a reason they say markets can stay irrational longer than you can remain solvent, and that applies to both euphoric and pessimistic conditions. Signs that a market may be nearing a top include, but are not limited to:
- A surge in IPOs, particularly those of low quality
- Nonsensical upside in short spaces of time
- Loose credit conditions
- Excessive leverage
- High trading volumes & heavy retail participation
- Financial media overtly bullish
- Euphoria about new innovations or technology
- Cycle of social proof pulls in waves of new inexperienced investors
- Historically high valuations
- Heavy M&A activity
- VCs spending like they have holes in their pockets
- Series As, Bs, and Cs, with no revenue
- The frequential muttering of “this time its different”
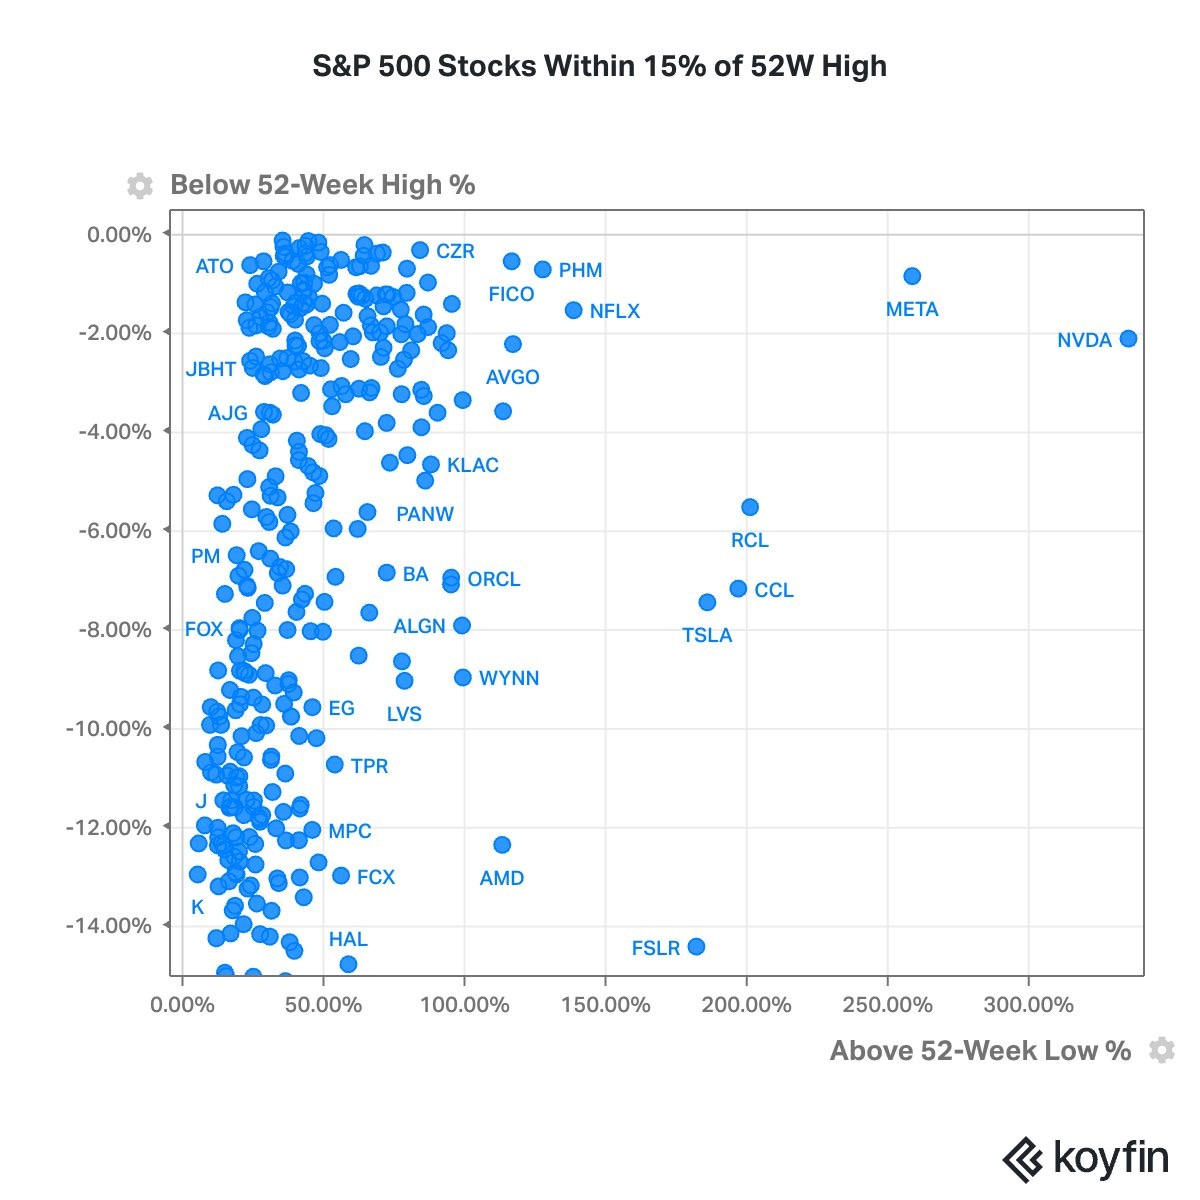
- A siginficiant drop off in companies reaching 52W highs
- Investors begin to confuse the bull market for brains
- Fundamentals are ignored
For the sake of ease, we can assume the signs of market bottoms are more or less the inverse of the variables I outlined above. I would add here that in the event a market crash is triggered by an economic shock, the stock market tends to recover several months before the economy. It’s not uncommon to see the market begin to march upward while the trailing economic data continues to look terrible. It usually catches up 6-12 months down the line. This is the pendulum effect; where the ball of the pendulum represents the market’s time horizon. As uncertainty creeps in, it swings towards us and the market prices in the near term. As uncertainty fades, it swings away from us, and the market starts looking years out.
There are strong arguments to suggest we are not near a market top. Credit conditions have tightened considerably over the past 12 months, with most major central banks still in a rate hike cycle. Demand for corporate loans recently sunk to 2008 levels
While there are still a few variables up for contention and some signs of excess in various pockets, there are enough major signals that have been struck to imply we are not near a market top. The consensus at the moment appears to be that we have already bottomed, and are now making our way through the scepticism part of the curve. Somewhere between the second and third quarter; if you recall the NFL analogy I presented earlier.
- Second Quarter: Earnings and fundamental estimates are revised upwarwards in light of more optimistic outlook. The market begins to react positivley.
- Third Quarter: Somewhat of a lock-out rally. The market continues to march on. Those who were previously sceptical and sitting on the sidelines give up and join in. This is called “the chase”.
Each “inning” can last years. While the last few years have been characterised by market cycles that felt like someone sat on the fast-forward button, cycles can take years to unwind and have proven to be able to persistently grind higher for as long as a decade or more; catching its breath at various intervals. Someone recently shared a great passage (I am unaware of its source) that highlights how the 2000 bubble broke down over time; not as instantaneously and violently as some may recall.

This was the result of what Gail Dudack once called a “stealth bear market”. She continued to remark that the unwinding of the bubble was like watching a movie in slow motion. She also notes that the trough may feel like slow motion too.
Why Do Care About Innings?
There will never be complete agreement among market participants. That is essentially what makes a market. But why do investors care about trying to pinpoint exactly where we are in a cycle? It can only be an educated guess, at best. It reasons that investors are applying heuristics to simplify their decision-making process, or as Daniel Kahneman might say; “substituting a difficult question with an easier one”. There are an infinite number of variables that factor into deciding the maturity of a bull market, and when its deathbed will arrive. A similar practice can be employed in estimating our own life expectancy. The ONS suggests my mine is ~80 years. Thereby replacing a difficult question; “when am I going to die?” with an easy one. Some comfort might come from knowing that, on average, if I ran a thousand simulations of my life I have 55 years or so left. Similarly, some comfort may come from reducing exposure near what you consider to be a market top. But in both life and markets, black swans are always out there.
My point is this. Nobody, not even god, knows precisely when a market cycle is going to end. Attempting to predict these cycle shifts with precision is tough work. There are some who are expertly skilled at forecasting however; you might have noticed that economists have predicted 200 of the last 5 recessions. I reason a more effective use of time is spent identifying companies that can survive a little economic turmoil and come out the other side standing.
Thanks for reading,
Conor
To find more of Conor’s work, check out Investment Talk.
***
It’s not just the wider stock market that moves to a rhythm. In this online stock trading event, our star trader, Eoin Treacy reveals what’s really behind stocks that move rapidly enough to generate exceptional gains. Once you know the three signals, you’ll be able to identify such opportunities yourself. Learn how, here.
Kind regards,
![]()
Nick Hubble
Editor, Fortune & Freedom