We’ve been warning of a recession in Fortune & Freedom for just under a year now. “And then came the recession,” I wrote to you back then. But that was still speculation at the time. All I had was a suspicion that the GDP statistics were missing something important.
The predictions only gradually improved in confidence since then. But there was a moment in April when I finally ticked the recession box. And today, I want to show you what that moment was.
After all, the UK’s GDP for the second quarter of 2022 went negative, if only by a measly 0.1%. Is this a sign of the prolonged and severe recession which the Bank of England is predicting?
Yes, it is.
But, for today, I want to explore the particular recession predictor that allows you to tick off a recession before it happens. In fact, let’s take a look at what I wrote in Gold Stock Fortunes back in April in a report titled, “It’s time to prepare for a recession… but how?”
***
The reliable recession indicator
Over the past few weeks, the world’s most reliable recession indicator was triggered. It’s much the same type of signal as I highlighted to you in the Eurodollar futures market, but it took place in the United States’ domestic bond market instead. But let’s briefly review underlying idea.
The yield curve shows the price at which a government can borrow money for various lengths of time (maturities). Here are the UK’s yield curves on 17 March and 29 March.
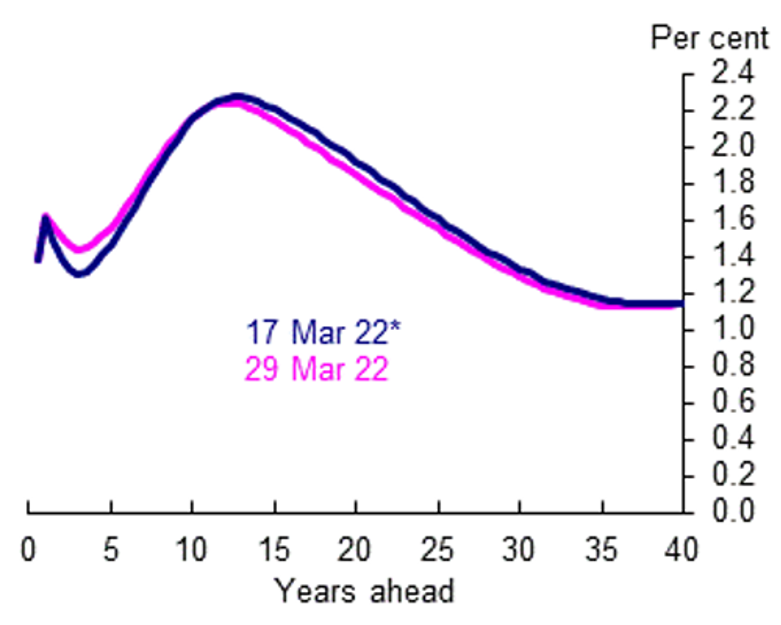 Source: Bank of England
This shows that the UK government can borrow money for a year at about 1.6%, for four years at about 1.4%, for ten years at about 2% and for 30 years at 1.2%.
This isn’t very interesting, until you consider that the yield curve is not supposed to look like this at all. It is supposed to be a slightly curved but continuously upward sloping line.
So, why is the yield curve all squiggly?
Well, the yield curve doesn’t just show you government borrowing costs for different maturities. It also reveals the anticipated interest rates of the future.
The interest rates of our future
When central banks fiddle with interest rates, this directly impacts government bonds too. And so, a government’s yield curve can be seen as a central bank interest rate forecast of sorts.
If that’s true, then financial markets are expecting UK interest rates to rise over the next year or so, then fall for about two years, then rise for about ten years and then fall over the subsequent 30 years.
This is, in economics parlance, a complete mess. But focus on the next ten years. Do you see the ✔ shape in the yield curve? That is the focus of this month’s issue, as well as our prediction that a recession is coming.
The ✔ shape is only consistent with one prediction for the next five years: the Bank of England will tighten monetary policy for a few months, thereby triggering a recession, which then requires interest rates to be cut again, followed by a return to higher rates in the years thereafter. All this will occur within the next five years.
A recession is coming to the United States
The American yield curve has an excellent track record at predicting recessions. It’s a very simple signal. When the yield curve inverts for more than a month, a recession follows. This has been true for 50 years. (Briefer inversions of the yield curve have a mixed track record.)
But what exactly is an inversion?
As noted, the yield curve is supposed to be upward sloping – the longer the government borrows the money for, the more interest it must pay. An inversion is when shorter term borrowing rates are higher than longer term ones.
Graphically speaking, an inverted yield curve is a ✔ shape in the yield curve. It shows that interest rates are expected to fall below current levels in the future – something that tends to happen when central banks lower interest rates to fight off a recession.
This inversion can occur across a variety of maturities. But economists like to compare the two-year to the 10-year bond yield most of all, because of its reliable recession predicting credentials in the past. When the two-year yield is higher than the 10-year, the yield curve is said to be inverted.
The recession signal just went off
Sure enough, Bloomberg reported on 29 March: “Bond Market Flashes Recession Signal as Key Yield Gap Inverts”.
The U.S. two-year yield briefly exceeded the 10-year Tuesday for the first time since 2019, inverting yet another segment of the Treasury curve and reinforcing the view that Federal Reserve rate increases may cause a recession.
It’s not just the two-year and 10-year that has inverted though. A list of other popular yield curve comparisons also inverted over the past few months. But the twos and 10s is considered the most reliable indicator of a recession.
Here is the reaction to the news: Federal Reserve Chair Jerome “Powell has said short-term curve shows no growth worries”. Which echoes one of his predecessors rather nicely: “I would not interpret the currently very flat yield curve as indicating a significant economic slowdown to come,” said Ben Bernanke in March 2006. And we know what happened next…
As you’ll discover, the connection between the yield curve inverting and a recession is not the focus of this monthly issue. It is only where my rabbit hole began. But it is important because a recession is bad news for the stock market generally, not to mention the economy.
***
What makes our recession so intriguing is that inflation is extremely high at the same time. This complicates matters for investors in a long list of ways. More on that soon. Alternatively, you can just click here if you’re feeling impatient and want an answer from Nigel Farage…
![]()
Nick Hubble
Editor, Fortune & Freedom