Investment markets suffer frequent bouts of bubbles and busts. But spotting them in advance is no easy task.
However, once they’re in place, they’re relatively easy to identify.
When markets crash, they often get oversold. Many bargains are there for the taking, for those brave enough to step in (and with cash on hand). Riding the recovery can be a great way to make substantial profits.
Bubbles aren’t that hard to spot either. Prices that double or triple in a year, or just a few months or even weeks, give you a big clue. When it comes to stocks, so do highly inflated market valuation ratios, especially if they’re seriously out of whack with historical averages.
That said, although bubbles are fairly easy to spot, it’s always hard to predict when they’ll burst. Just because XYZ stock or sector or country index is trading at eye-watering prices doesn’t mean it can’t keep rising for a time, often substantially.
However, all investment bubbles burst eventually. Just like their physical namesakes, they’re fragile entities. And the bigger they get, the more fragile they become.
To help understand this, we can think about what a market price really represents.
Published market prices are merely the current voluntary meeting point between marginal buyers and sellers. That’s where a few investors are willing to transact with each other at a point in time.
In other words, it’s the current opinion of a small sub-set of the market mob. A few prospective buyers think it’s a fair price to pay. A similar number of sellers think it’s a fair price to receive.
Meanwhile, the bulk of potential traders of a given asset are sitting on the side lines, most of the time. They’re either happy to keep what they’ve got, or not tempted to buy what they don’t yet have.
But that changes constantly.
As an asset’s price rises, more of the current owners are coaxed out from the shadows and prepared to cash in their gains and move on. At the same time, there are progressively fewer buyers who can rationalise a strong investment case at the new, higher price.
Eventually, the buyers run out. Or they run out of spare cash to throw at the bubble. The market starts to turn. Asset owners, keen to lock in their gains before it’s too late, hit their sell buttons.
Prices are marked down in an attempt to draw in new buyers. If panic sets in, then the result is a sharp “correction” or full-blown crash.
But investment bubbles don’t tend to burst overnight. It’s a process that can take many months and sometimes years.
After all, bubbles are built on waves of speculative optimism for the newest of new things. If enough people still believe the hype, prices can bounce up again after an initial sharp fall.
In the gallows humour of the finance world, such a scenario is sometimes called a “dead cat bounce”. The idea being that anything will bounce if dropped from a great enough height, even a dead cat.
Anatomy of a crash
Let’s pick one example to illustrate. The late 1990s saw a huge bubble in technology, media and telecoms (TMT) stocks. Within that were the infamous “dot coms”, that were going to take the nascent internet by storm and generate fantastic profits.
Unfortunately, in most cases, the profits weren’t fantastic, but pure fantasy. After a frenzy of capital raising and parabolic rises in stock prices, reality eventually set in. The bubble started to burst in March 2000.
We can get a snapshot of what happened by looking at a chart of the Nasdaq 100 index at the time. It’s a tech-heavy index of US stocks.
Nasdaq 100 index (1 June 1996 to 1 June 2004)
 Source: Koyfin
You can see that the index peaked in March 2000. It then fell hard in April, bounced briefly, fell sharply again in May, bounced again to mid-July, fell again, then rose again in August.
Then, in September 2000, the Nasdaq 100 started to fall seriously, with some bumps along the way. It didn’t finally reach the bottom until October 2002, over two and a half years after the March 2000 peak. By then it was down almost 80%. Many individual stocks saw even bigger falls.
Clearly, there was a tussle between buyers and sellers all the way down, especially in the early stages of the crash. Every seller needs a buyer. As some scrambled to get out, others piled in, thinking they were getting a bargain. They’d bought into the earlier hype and couldn’t imagine prices going lower. On the contrary, they had a fear of missing out on a big price rebound.
Is this happening again?
Now let’s jump forward to today. There’s no doubt that certain parts of the markets have been trading at racy valuations and showing signs of being in a bubble.
This applies, once again, to quite a lot of the tech stocks. But it’s perhaps most obvious in the clean energy sectors of the stock markets.
One way to get a snapshot is to look at the iShares Global Clean Energy ETF (ICLN), which invests in a range of clean energy stocks. It has a price-to-earnings (P/E) ratio of just under 32, which is already high enough. But, in common with most ETFs I’ve come across, that excludes negative P/Es, meaning any loss-making companies held in the fund.
If we aggregated all the company profits and losses and divided the total into the market capitalisation of all the companies, the resulting P/E would almost certainly be higher.
Just looking at the largest holding – Plug Power Inc. (NASDAQ:PLUG) – it’s over 7% of the fund and is loss making, and thus excluded from the disclosed P/E figure for the fund. The second largest holding – Enphase Energy (NASDAQ:ENPH) – has a P/E of 150 at the time of writing, which is huge.
Below is the chart of ICLN for the past three years.
iShares Global Clean Energy ETF (ICLN)
Past three years
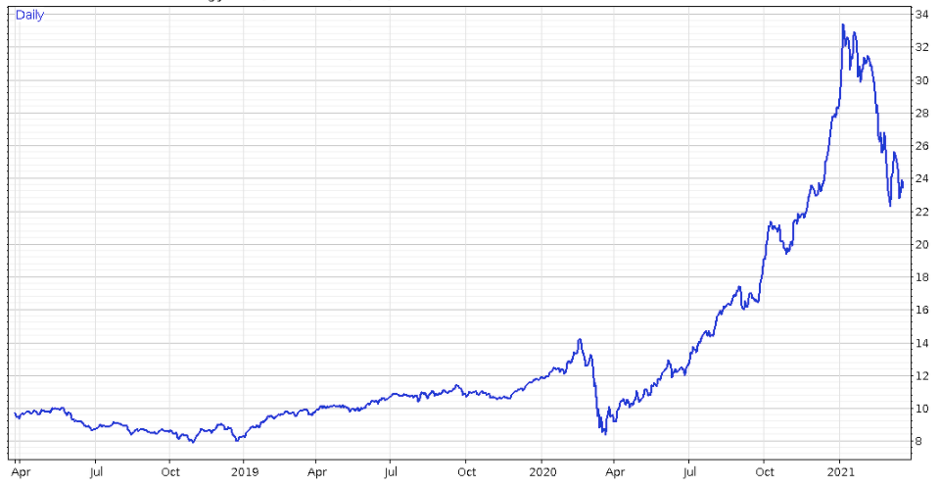 Source: Fuller Treacy Money
This sector has clearly rocketed since early 2020. ICLN itself roughly tripled in the 12 months to January this year. That’s a clear red flag that a bubble is afoot.
Since then, it’s plunged, losing nearly a third since the peak. But it’s also shown signs of a bounce during March.
The question must then be whether that’s it, and there are no more sharp falls to come? Or is this merely the start of something bigger?
Are we just seeing a temporary “dead cat bounce” before the clean energy crash re-starts in earnest, as happened to tech stocks in the years 2000 to 2002?
There’s no way of knowing for sure. But, in my opinion, the risks of further sharp falls remain high. That’s not just in the clean energy stocks but also in other pricey parts of the markets, including other “new economy” type stocks.
But here’s the thing. When bubbles pop, not everything drops.
Investors start looking around for new, safer places to park their funds. Often in the stocks of cheap and neglected sectors, with sound financial condition, stable businesses and attractive dividend yields.
As the Nasdaq 100 and other tech stocks crashed after March 2000, some stocks did really well. They’d been out of favour during the tech bubble and become cheap. They were deep value, meaning they were cheap. As the tech bubble burst, they provided a profitable haven for investors.
There was a “great rotation”. Money fled the bubble and landed in safer places. For example, look at the stock chart below, which runs from March 2000 (the tech bubble peak) to January 2008 (shortly before the global financial crisis really got going).
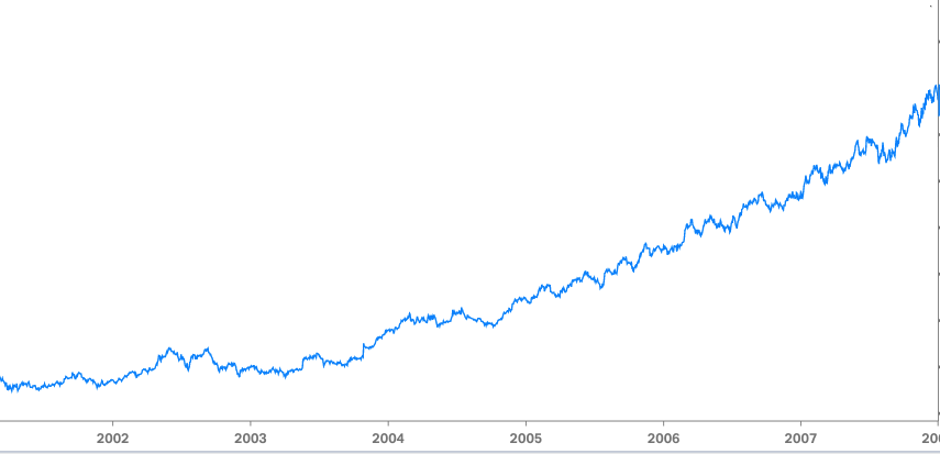 Source: Koyfin
Over those nearly eight years, this stock rose more than four times, measured in US dollars. Not to be sniffed at.
What’s more, this stock is in a sector that’s again been deeply out of favour in recent years, as bubbles have inflated elsewhere. It now offers a dividend yield above 7% a year, profits that are likely to grow at a high single-digit rate, on average, and (in my opinion) a very cheap share price.
Will history repeat? Are we at the start of another great rotation out of bubbly sectors like clean energy, tech and other “new economy” stocks? I believe we could be. Which means investors need to look elsewhere for profits over the coming years.
In February, I recommended the stock shown above to subscribers to UK Independent Wealth.
If you’d like to find out more, I encourage you to take a look at UK Independent Wealth.
The “Great Rotation” could be upon us. That has its risks. But it also offers the prospect of great opportunities for profit.

Rob Marstrand
Investment Director, UK Independent Wealth